Decisions won’t wait for perfect conditions. Your data shouldn’t either.
Deloitte’s 2026 commercial real estate outlook, respondents once again found cause for optimism in CRE, with 83% of respondents expecting their revenues to improve by the end of the year. This same trend holds true across expectatios for spending and CRE fundamentals, indicating that the sector is headed for recovery.
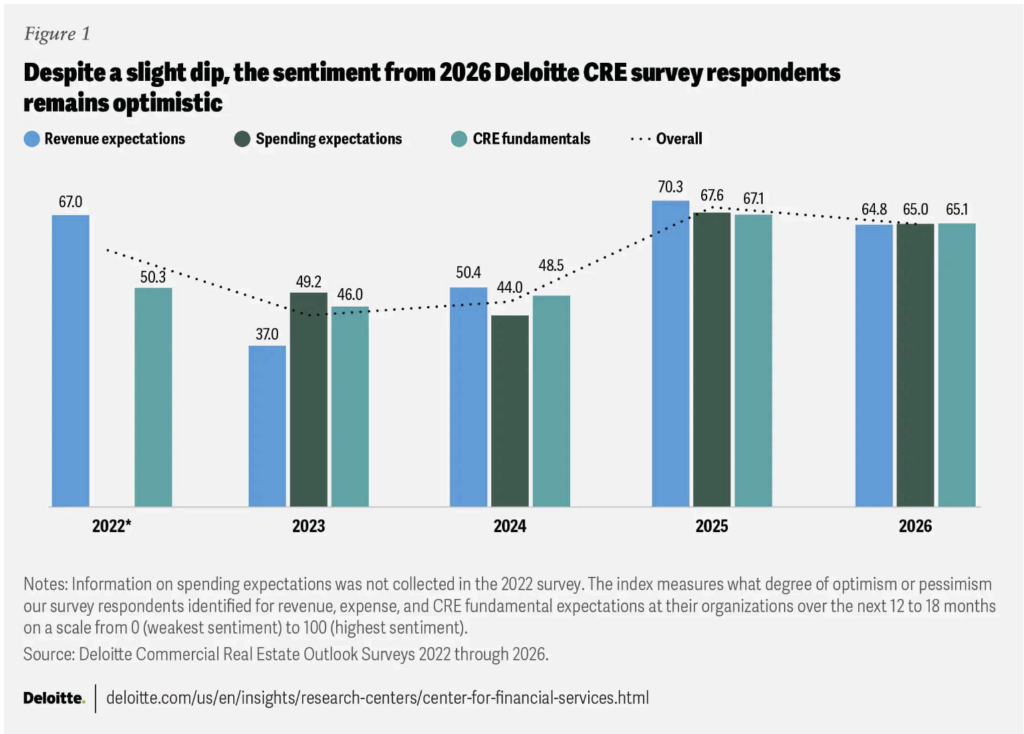
That said, rates, policy, and capital availability may keep the recovery uneven, according to Deloitte. But the firms that outperform won’t be the best prognosticators; they’ll be the fastest adapters. Data agility is the ability to ask (and answer) new questions quickly – without rebuilding spreadsheets, re-chasing files, or reconciling conflicting versions.
For asset managers up to the C-suite, that looks like:
- Running “what-if” scenarios (rates, cap rates, rent growth) off a single, trusted dataset
- Comparing budget vs. underwriting vs. actuals without exporting or re-keying
- Rolling up exposures across funds, loans, assets, tenants, and markets in minutes
- Producing investor and lender packs from the same source of truth
Pereview was built precisely for this: fund-to-lease intelligence, AI-powered data ingestion, two-way Excel model connection, and native Power BI ad-hoc analysis – all in a single platform.
What slows teams down (and how to remove it)
1. Data is scattered
Challenge: Rent rolls in portals, trial balances in accounting, leases/loans in PDFs, underwriting on shared drives.
Fix with Pereview: AI-assisted ingestion (rent rolls, TBs, leases, loan docs) + standardized COA/metrics bring everything into one model.
2. Spreadsheets are fragile
Challenge: Each scenario means another copy of the workbook. One broken link and the IC deck slips a week.
Fix with Pereview: Two-way Excel model connection preserves your logic while centralizing assumptions and outputs; scenarios become parameters, not file forks.
3. Reporting is static
Challenge: Dashboards are pretty – but hard to tweak when IC asks a left-field question.
Fix with Pereview: Power BI in Pereview (no exports) lets you build or adjust visuals on the fly using live operational and financial data.
4. Variances don’t loop back into action
Challenge: Teams note exceptions but struggle to close the loop.
Fix with Pereview: Variance capture and workflow automation route issues to owners, track remediation, and document decisions.
Four high-impact, agility use cases
Hold-sell readiness, every month
- Side-by-side: latest actuals, original underwriting, current budget
- Sensitize cap rates, debt terms, and business-plan timing
- Output: IC one-pager + underlying detail from the same dataset
“Loan-maturity mountain” triage
- Portfolio heatmap of refi dates, DSCR resets, covenants, lender terms
- Early looks at private credit vs. bank refi options with standardized term-sheet comparisons
- Output: ranked actions, by risk and ROI
Sector & market rebalancing
- Compare exposures across data centers, logistics, office, and needs-based housing with unified KPIs
- Run “rotate 5% from X to Y” scenarios and see impact on fund metrics
- Output: CIO/CFO package with traceable assumptions
Investor & lender transparency without spreadsheet sprawl
- LP and lender packs generated from the same trusted data (with audit trails)
- Role-based access for partners and JVs; consistent definitions across entities
- Output: faster diligence, lower friction, less spread nd fund mandates. Where you are in the fund life helps dictate whether you may be looking to sell or not.
3. Why the data-agility architecture works
- Single source of truth across equity and debt, from acquisitions to operations to dispositions
- Standardization (COA, metric dictionary, naming conventions) so every roll-up matches
- Excel model connection so you keep your modeling IP without creating version chaos
- AI-powered ingestion to turn PDFs and flat files into structured fields fast
- Embedded analytics (Power BI) for truly ad-hoc exploration – no exports
Workflow automation to capture variance notes, approvals, and close-the-loop tasks
4. KPIs to monitor your agility
Time to insight: go from hours or day to minutes from question to answer
- Scenario frequency: number of investment committee-grade scenarios delivered per week
- Reconciliation rate: percent of reports using centralized, standardized data
- Variance closure: percent variances with owner, action, and due date logged
Excel footprint: number of disconnected files needed to produce monthly reporting
What your team experiences
Asset managers stop hunting files and start testing moves
- CFOs get audit-ready packs and cleaner lender conversations
- CIOs visualize portfolio shifts before committing capital
- IC sees fewer surprises, more conviction
You can’t control interest rates, valuations, or policy. What you can control is how fast your team can respond to them. Pereview gives you the platform and processes to turn every shift in the market into a moment of clarity, uniting your data, your team, and your decisions in one place.